Note
Click here to download the full example code
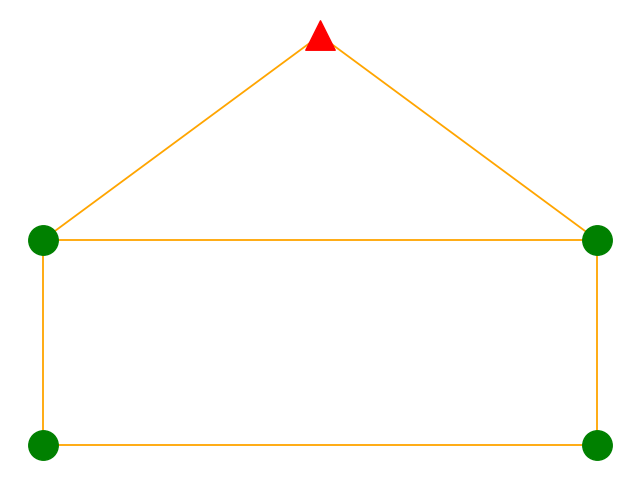
Draw a house
In this example we draw a graph using custom positions for the vertexs. You must have matplotlib installed for this to work.
Start by importing the package
import jgrapht
import jgrapht.drawing.draw_matplotlib as drawing
import matplotlib.pyplot as plt
Creating a graph
g = jgrapht.create_graph(directed=False, weighted=True)
Add some vertices
for i in range(0, 5):
    g.add_vertex()
and some edges
e1 = g.add_edge(0, 1)
e2 = g.add_edge(0, 2)
e3 = g.add_edge(1, 3)
e4 = g.add_edge(2, 3)
e5 = g.add_edge(2, 4)
e4 = g.add_edge(3, 4)
Compute the position of the vertices
positions = [(0, 0), (1, 0), (0, 1), (1, 1), (0.5, 2.0)]
Draw the graph
# Draw the vertexs using the vertex list and vertex color
drawing.draw_jgrapht_vertices(
    g, positions=positions, vertex_list=(0, 1, 2, 3), vertex_color="green"
)

# Draw the vertexs using the vertex list, vertex color and vertex shape
drawing.draw_jgrapht_vertices(
    g, positions=positions, vertex_list=[4], vertex_color="red", vertex_shape="^"
)

# Draw the edges using edge color
drawing.draw_jgrapht_edges(g, positions=positions, edge_color="orange")

plt.tight_layout()
plt.show()
Total running time of the script: ( 0 minutes 0.085 seconds)