Note
Click here to download the full example code
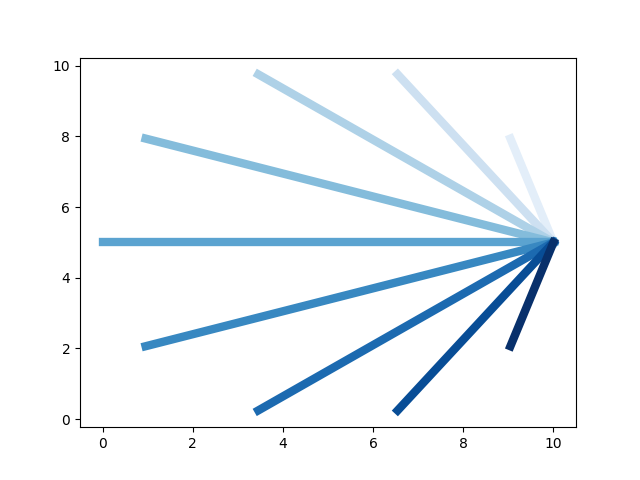
Edge Colormap
In this example we draw a graph with matplotlib using the circular layout. We also use vertex degree to color some edges. You must have matplotlib installed for this to work.
Start by importing the package
import jgrapht
import jgrapht.drawing.draw_matplotlib as drawing
import matplotlib.pyplot as plt
import numpy as np
Creating a graph
g = jgrapht.create_graph(directed=False, weighted=True,)
Add some vertices
for i in range(0, 10):
    g.add_vertex()
and some edges
e1 = g.add_edge(0, 1)
e2 = g.add_edge(0, 2)
e3 = g.add_edge(0, 3)
e4 = g.add_edge(0, 4)
e5 = g.add_edge(0, 5)
e6 = g.add_edge(0, 6)
e7 = g.add_edge(0, 7)
e8 = g.add_edge(0, 8)
e9 = g.add_edge(0, 9)
Compute the position of the vertices
positions = drawing.layout(g, name="circular")
Draw the graph using the node labels and the edge line width and edge colormap
drawing.draw_jgrapht(
    g,
    positions=positions,
    edge_linewidth=6,
    edge_cmap=plt.cm.Blues(np.linspace(0.1, 1, len(g.edges))),
    axis=False,
)
plt.show()
Total running time of the script: ( 0 minutes 0.125 seconds)