Note
Click here to download the full example code
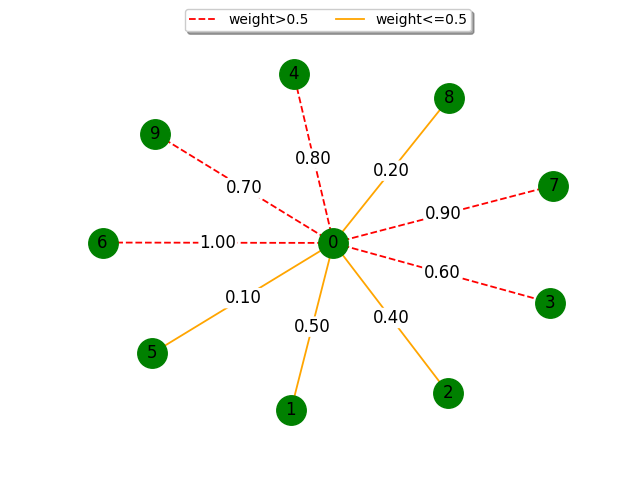
Weighted Graph
In this example we draw a graph as a weighted .You must have matplotlib for this to work.
Start by importing the package
import jgrapht
import jgrapht.drawing.draw_matplotlib as draw_matplotlib
import matplotlib.pyplot as plt
Add some vertices
g = jgrapht.create_graph(directed=False, weighted=True,)
add vertex
g.add_vertex()
g.add_vertex()
g.add_vertex()
g.add_vertex()
g.add_vertex()
g.add_vertex()
g.add_vertex()
g.add_vertex()
g.add_vertex()
g.add_vertex()
Out:
9
and some edges
e1 = g.add_edge(0, 1, weight=0.5)
e2 = g.add_edge(0, 2, weight=0.4)
e3 = g.add_edge(0, 3, weight=0.6)
e4 = g.add_edge(0, 4, weight=0.8)
e5 = g.add_edge(0, 5, weight=0.1)
e6 = g.add_edge(0, 6, weight=1)
e7 = g.add_edge(0, 7, weight=0.9)
e8 = g.add_edge(0, 8, weight=0.2)
e9 = g.add_edge(0, 9, weight=0.7)
create list of edges depending on their weights
weight_large = [e for e in g.edges if g.get_edge_weight(e) > 0.5]
weight_small = [e for e in g.edges if g.get_edge_weight(e) <= 0.5]
Compute the position of the vertices
positions = draw_matplotlib.layout(g, seed=10, name="fruchterman_reingold")
Draw the graph
# Draw nodes
draw_matplotlib.draw_jgrapht_vertices(g, positions=positions)

# Draw the edges using edge list,edge color,edge title and line style
draw_matplotlib.draw_jgrapht_edges(
    g,
    positions=positions,
    edge_list=weight_large,
    edge_color="red",
    edge_title="weight>0.5",
    line_style="dashed",
)

draw_matplotlib.draw_jgrapht_edges(
    g,
    positions=positions,
    edge_list=weight_small,
    edge_color="orange",
    edge_title="weight<=0.5",
)

# Draw node labels
draw_matplotlib.draw_jgrapht_vertex_labels(g, positions=positions)
# Draw edge labels with their weight
draw_matplotlib.draw_jgrapht_edge_labels(g, positions=positions, draw_edge_weights=True)

plt.show()
Total running time of the script: ( 0 minutes 0.132 seconds)