Note
Click here to download the full example code
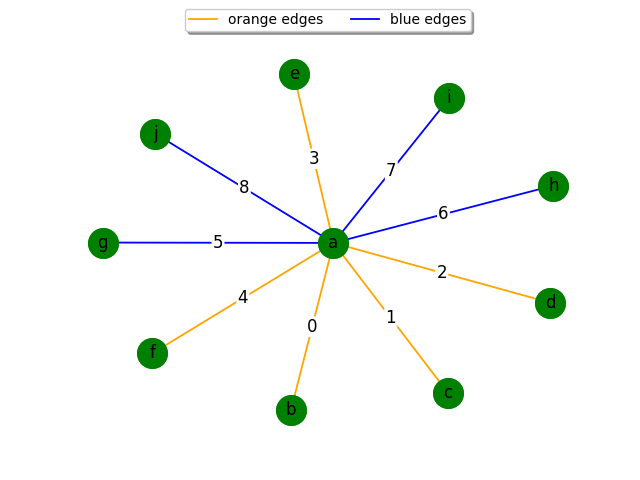
Labels And Colors
In this example we draw a graph with vertex labels. You must have matplotlib for this to work.
Start by importing the package
import jgrapht
import jgrapht.drawing.draw_matplotlib as draw_matplotlib
import matplotlib.pyplot as plt
Creating a graph
g = jgrapht.create_graph(directed=False, weighted=True)
Add some vertices
for v in range(10):
    g.add_vertex(v)
and some edges
e0 = g.add_edge(0, 1)
e1 = g.add_edge(0, 2)
e2 = g.add_edge(0, 3)
e3 = g.add_edge(0, 4)
e4 = g.add_edge(0, 5)
e5 = g.add_edge(0, 6)
e6 = g.add_edge(0, 7)
e7 = g.add_edge(0, 8)
e8 = g.add_edge(0, 9)
Compute the position of the vertices
positions = draw_matplotlib.layout(g, seed=10, name="fruchterman_reingold")
Draw the graph
# Draw vertices with title
draw_matplotlib.draw_jgrapht_vertices(
    g, positions=positions, node_list=(0, 1, 2, 3, 4), node_title="green nodes"
)
draw_matplotlib.draw_jgrapht_vertices(
    g, positions=positions, node_list=(5, 6, 7, 8, 9), node_color="red", node_title="red nodes"
)

# Draw the edges with edge list, edge color and edge title
draw_matplotlib.draw_jgrapht_edges(
    g,
    positions=positions,
    edge_list=(e0, e1, e2, e3, e4),
    edge_color="orange",
    edge_title="orange edges",
)
draw_matplotlib.draw_jgrapht_edges(
    g,
    positions=positions,
    edge_list=(e5, e6, e7, e8),
    edge_color="blue",
    edge_title="blue edges",
)

# Draw the vertex labels with custom vertex names
draw_matplotlib.draw_jgrapht_vertex_labels(
    g,
    positions=positions,
    labels={
        0: "a",
        1: "b",
        2: "c",
        3: "d",
        4: "e",
        5: "f",
        6: "g",
        7: "h",
        8: "i",
        9: "j",
    },
)

# Draw the edge labels with custom edge names
draw_matplotlib.draw_jgrapht_edge_labels(
    g,
    positions=positions,
    edge_names={0: "a", 1: "b", 2: "c", 3: "d", 4: "e", 5: "f", 6: "g", 7: "h", 8: "i"},
)

plt.show()
Total running time of the script: ( 0 minutes 0.133 seconds)