Note
Click here to download the full example code
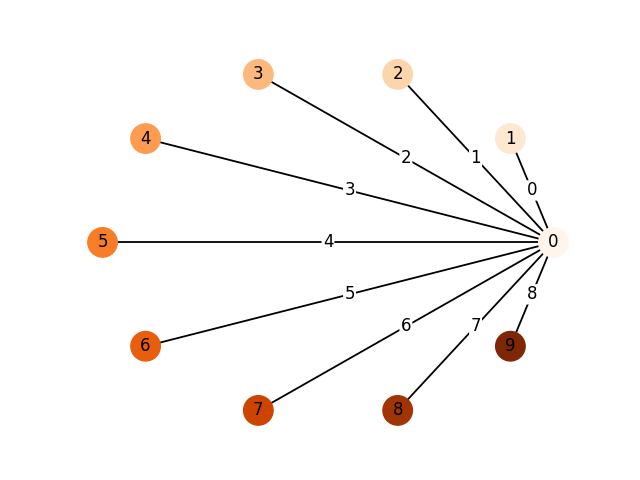
Vertex Colormap
In this example we draw a graph with matplotlib using the circular layout, coloring vertices by degree. You must have matplotlib for this to work.
Start by importing the package
import jgrapht
import jgrapht.drawing.draw_matplotlib as draw_matplotlib
import matplotlib.pyplot as plt
Creating a graph
g = jgrapht.create_graph(directed=False, weighted=True,)
Add some vertices
for v in range(10):
    g.add_vertex(v)
and some edges
e1 = g.add_edge(0, 1)
e2 = g.add_edge(0, 2)
e3 = g.add_edge(0, 3)
e4 = g.add_edge(0, 4)
e5 = g.add_edge(0, 5)
e6 = g.add_edge(0, 6)
e7 = g.add_edge(0, 7)
e8 = g.add_edge(0, 8)
e9 = g.add_edge(0, 9)
Compute the position of the vertices
positions = draw_matplotlib.layout(g, name="circular")
Draw the graph using the vertex labels, edge labels and vertex colormap
draw_matplotlib.draw_jgrapht(
    g,
    positions=positions,
    vertex_labels={v: v for v in g.vertices},
    edge_labels={e: e for e in g.edges},
    vertex_color=range(len(g.vertices)),
    vertex_cmap=plt.cm.Oranges,
    axis=False,
)
plt.show()
Total running time of the script: ( 0 minutes 0.110 seconds)