Note
Click here to download the full example code
Communities Detection using Label Propagation
In this example we discover communities using label propagation.
Start by importing the package.
import jgrapht
from jgrapht.algorithms.clustering import label_propagation
We start by creating a graph which has 3 communities.
g = jgrapht.create_graph(directed=False, weighted=True)

for i in range(16):
    g.add_vertex(i)

g.add_edge(0, 1)
g.add_edge(1, 2)
g.add_edge(2, 3)
g.add_edge(3, 4)
g.add_edge(1, 3)
g.add_edge(1, 4)

g.add_edge(5, 6)
g.add_edge(6, 7)
g.add_edge(7, 8)
g.add_edge(8, 9)
g.add_edge(9, 10)
g.add_edge(5, 8)
g.add_edge(5, 10)

g.add_edge(11, 12)
g.add_edge(12, 13)
g.add_edge(13, 14)
g.add_edge(11, 15)
g.add_edge(12, 15)

g.add_edge(1, 5)
g.add_edge(9, 11)

print(g)
Out:
({0, 1, 2, 3, 4, 5, 6, 7, 8, 9, 10, 11, 12, 13, 14, 15}, {0={0,1}, 1={1,2}, 2={2,3}, 3={3,4}, 4={1,3}, 5={1,4}, 6={5,6}, 7={6,7}, 8={7,8}, 9={8,9}, 10={9,10}, 11={5,8}, 12={5,10}, 13={11,12}, 14={12,13}, 15={13,14}, 16={11,15}, 17={12,15}, 18={1,5}, 19={9,11}})
Then, we execute the label propagation algorithm.
clustering = label_propagation(g, seed=17)
The result is an instance of Clustering.
We convert the actual clusters to lists as they are returned as
iterators.
clusters = []
for i in range(clustering.number_of_clusters()):
    clusters.append(list(clustering.ith_cluster(i)))

print('# of clusters: {}'.format(len(clusters)))
print(clusters)
Out:
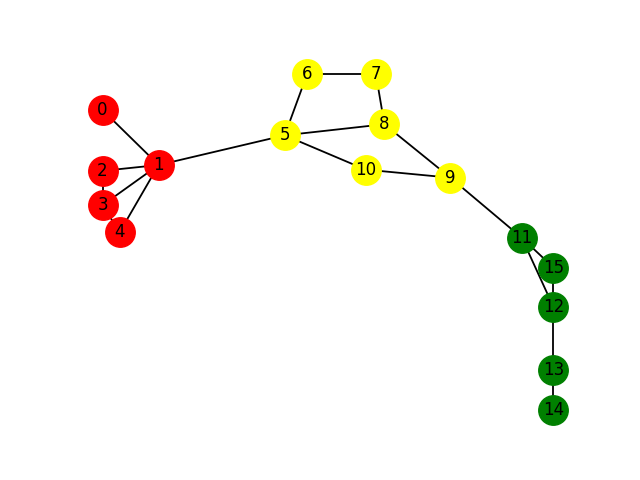
# of clusters: 3
[[0, 1, 2, 3, 4], [5, 6, 7, 8, 9, 10], [11, 12, 13, 14, 15]]
Ploting the graph with a separate color per community.
import jgrapht.drawing.draw_matplotlib as drawing
import matplotlib.pyplot as plt

positions = drawing.layout(g, name="fruchterman_reingold", seed=17)

vertex_labels = {v:str(v) for v in g.vertices}
colors = ['red', 'yellow', 'green']
for cluster, color in zip(clusters, colors):
    drawing.draw_jgrapht_vertices(g, positions=positions, vertex_list=cluster, vertex_color=color)

drawing.draw_jgrapht_vertex_labels(g, positions=positions, labels=vertex_labels)
drawing.draw_jgrapht_edges(g, positions=positions)

plt.show()
Total running time of the script: ( 0 minutes 0.124 seconds)